NIR
Near infrared spectroscopy
NIR is regularly used to analyse incoming goods or directly in the production process. The method allows for rapid and non-destructive determination of various parameters at the same time.
What is near infrared spectroscopy?
Near Infrared (NIR) spectroscopy is based on the response of molecular bonds within the sample to NIR radiation (800 nm to 2500 nm). Whenever NIR light interacts with a sample, the light is either absorbed, scattered, or reflected. These sample-light interactions produce a spectrum, which is a direct representation of the composition and physical properties of the sample.
The absorptions (peaks) refer to different functional groups depending on the wavenumber/wavelength/energy of the light that is absorbed. For example, an NIR spectrum of a product containing moisture exhibits peaks for O-H functional groups in the range of ca. 1400 to 1500 nm (7100 to 6500 cm-1) and ca. 1900 to 2000 nm (5200 to 5000 cm-1).
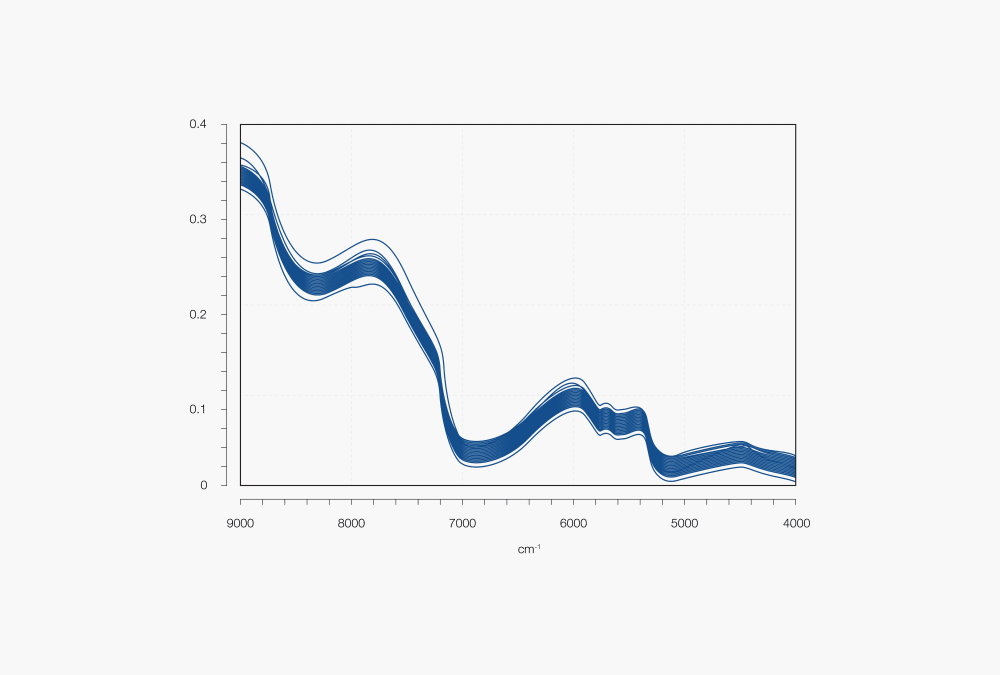
Figure 1: Example of NIR spectra of one sample type
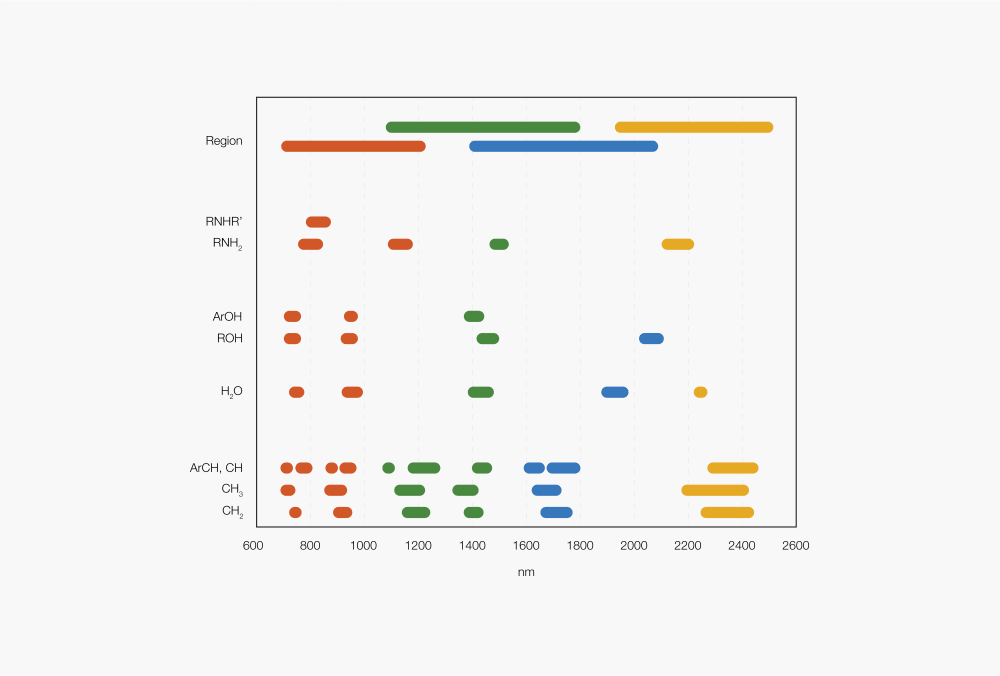
Figure 2: Absorption regions of different functional groups
■ combination bands
■ 1st overtones
■ 2nd overtones
■ 3rd overtones
Peaks in an NIR spectrum are broad and tend to overlap. It is mostly not possible to derive information directly from the spectrum. Instead, calibrations based on reference data from standard (wet-chemistry) methods are needed. This is the reason, NIR is a so-called secondary method, measurements are predictions based on chemometric calibration models.
While calibration itself may be resource-intensive, routine analysis is very fast and efficient. The simplicity of using the NIR method allows for operators of any skill level to achieve good measurement results. To speed up the implementation of NIR, it is possible to use pre-calibrated applications that include manifold samples of different composition and origin.
What parameters can be measured with near infrared spectroscopy?
Many different parameters can be measured after calibrating the system, as long as a constituent has an effect on the NIR spectra. NIR analysis is primarily a method for organic substances due to this fact (inorganic substances exhibit low interaction with NIR light). The most frequently analysed parameters are shown in the table, but many more such as lactose, salt, gluten, acids, alcohol, etc. are possible.
- moisture
- protein
- fat (or oil)
- ash
- fibre
- sugar
For food applications, consult a free Champion’s Guide to Food Analytics.
How to develop an NIR calibration model
Independent of the type of application, quantitative analysis or identification, matrices and compositions need to be ‘taught’ to the instrument.
To build a quantitative calibration, samples must be measured with the NIR instrument and afterwards analysed with a reference method such as Kjeldahl, fat extraction, drying oven, HPLC, titration, etc. The calibration model will then be build based on NIR spectra together with the assigned reference values. Because every matrix (product type) yields a different spectrum, one calibration per matrix and parameter is necessary. For example, a calibration for moisture in cheese cannot be used to determine moisture in flour.

Figure 3: The process of developing quantitative NIR calibrations
Ⓐ measurement with the NIR instrument
Ⓑ reference analysis (e.g. extraction)
Ⓒ adding reference values to the spectra
Ⓓ develop or update calibration
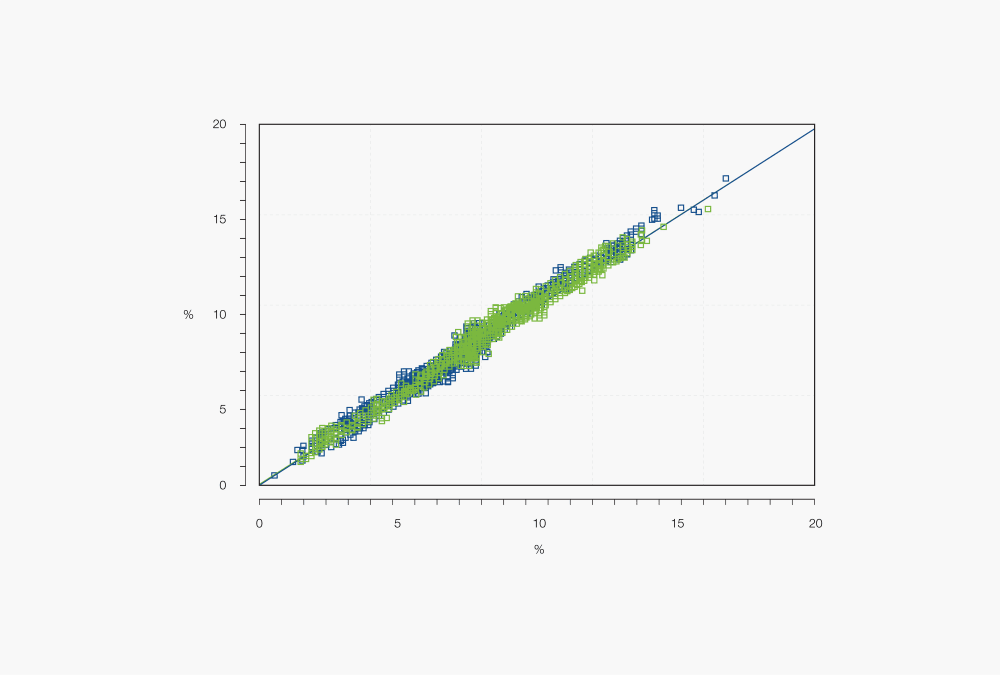
Figure 4: NIR calibration plot showing predicted versus reference values
By following this procedure, calibrations for manyfold products and parameters can be created. In general, near infrared spectroscopy can be applied to measure parameters in the percentage range; determinations in lower ranges are less accurate or even impossible. Distinguishing between two different parameters with similar chemical structures can also be challenging.
In case of raw material identification, so-called cluster calibrations are created. Here, the NIR spectrum of the different products are recorded and then assigned to the different substances. If the spectrum of a material fits into one of these clusters, it is recognized as this substance.

Figure 5: How to develop cluster calibrations in near infrared spectroscopy
Ⓐ measurement with the NIR instrument
Ⓑ reference analysis (e.g. HPLC)
Ⓒ assigning substances to the spectra
Ⓓ develop or update calibration
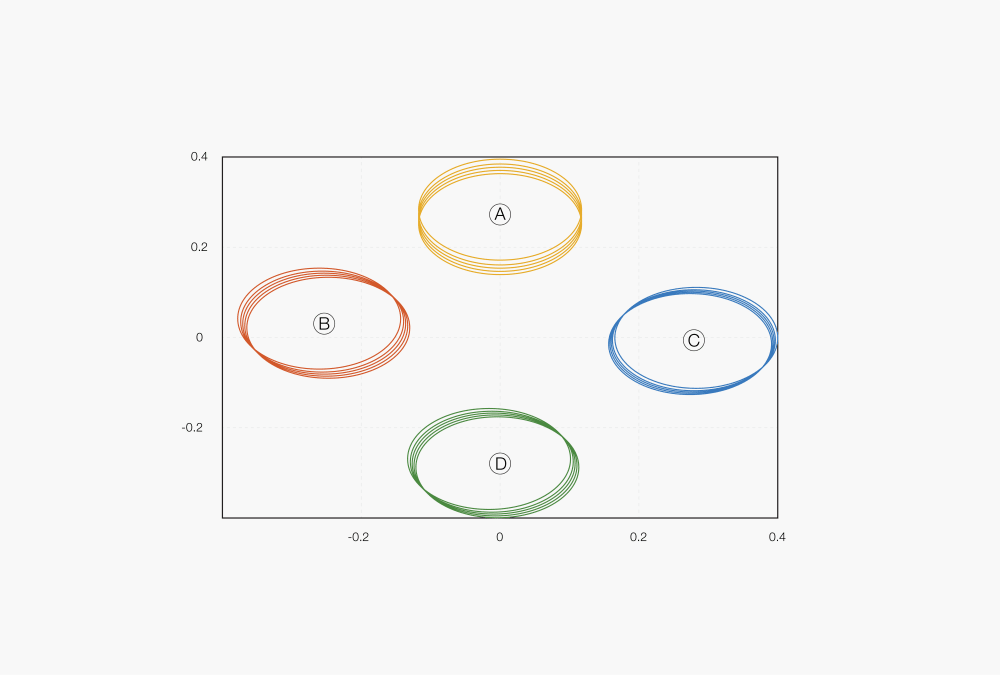
Figure 6: Example of a 2D projection of an NIR cluster-calibration
Ⓐ Cellulose
Ⓑ Silica
Ⓒ Glucose
Ⓓ Starch
Tips for developing successful NIR calibration models
The accuracy and the precision of measurements with an NIR instrument are based on the calibration models which themselves depend on the number of calibration samples, the selection of calibration samples as well as quality of the reference values obtained with the primary analysis methods.
Factors in NIR calibration model development
The calibration samples should be representative of the whole range of product variability, such as composition, particle sizes, supplier/batch variances, impurities, temperature ranges, season, and so on.
How many samples are needed for building calibrations is not easy to predict. The samples should be evenly distributed over the entire range of expected samples; if the working range is large, more samples in total are needed to build a calibration than if the range is small. The higher the amount of samples and the more variability is covered by them, the more robust the calibration model becomes.
The calibration range should be larger than the working range, to improve performance at the working range limits. Predictions outside of the calibration range are mere extrapolations
Robust NIR calibrations require reliable reference values. Standard errors and measurement uncertainty of the reference methods need to be considered since they are carried on to the calibrations models. The more accurate and precise the results from the reference method, the more accurate and precise the calibration model. These methods should be kept constant throughout the NIR calibration development cycle, as different laboratory methods can exhibit different results and also have different accuracy and precision relative to one another.
NIR vs. IR vs. Raman
All three analysis methods provide a structural fingerprint and provide measurements in seconds. Nonetheless, there are some differences.
Table 1: Advantages and Disadvantages of NIR, IR, Raman spectroscopy
Benefits | Limitations | |
|---|---|---|
NIR | - Can penetrate samples much better than mid-range IR - Possibility to measure more heterogeneous samples (in contrast to ATR-IR) - No need for sample preparation and dilution - Non-destructive method - Can measure parameters with polar bonds (O-H, N-H, S-H, C-O, etc.) - Simple system components, including simple lamp modules as light source | - Poorer resolution compared to IR and Raman |
IR | - Strong absorption bands (fundamental vibrations vs overtones) - Good separation of absorption bands - Can be used to quantify individual components in a mixture by strength of the absorption band - Can be used to identify substances based on spectra libraries | - Cannot be used with samples containing high amounts of water as water peaks might overlap peaks of interest - Cheap and easily accessible sample holders and instrument components (such as fibre optic probes) made from glass quartz or saphire cannot be used due to their own absorption |
Raman | - Non-destructive method - Narrower peaks and better separation than NIR - Fast measurements due to laser as light source | - Can only be used to detect nonpolar bonds - Cannot be used for analysis of moisture content - Laser as light source leads to more complexity in instrument components and danger of overheating the samples |
Overall, all three methods play key roles in quality control and process technology and it should be carefully evaluated which one brings the most benefit to the inquired application.